By Natalie Smith
This week, I worked on figuring out how much food a sailor ate in a week (hint: it’s A LOT!) and began converting these into macronutrient percentages and calories. Back in the 1600s, the measuring system was different than the measuring system we use today (which you can read in more depth in Somer’s blog).
Although we plan on looking at a few different rations, for this post we focused on the weekly provision list in George Croom’s print titled “The Glory of the British Seas: Being a List of the Royal Navy” dated to 1697.
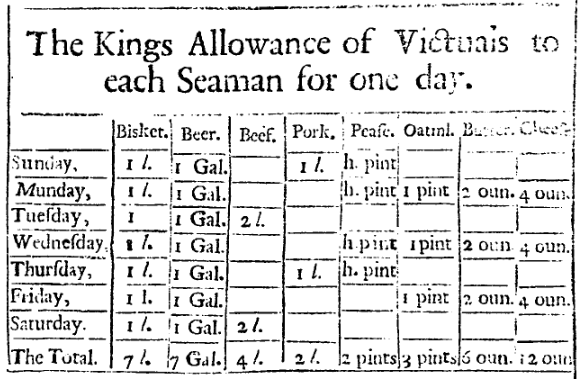
Each person on board was given 7 lbs of biscuits, 7 gallons of beer (that is A LOT of beer!), 4 lbs of beef, 2 lbs of pork, 2 pints of peas, 3 pints of oatmeal, 6 ounces of butter, 12 ounces of cheese in a single week.
Once that was figured out, we looked into a handy-dandy metrology book that held all sorts of conversions over different centuries. We used the Elizabeth I Winchester Avoirdupois system for pounds (1 lb = 453.6 g). We also used that system for butter and cheese with 1 oz liquid capacity = 28.68 mL and 1 oz dry weight = 28.35 g, respectively. For gallons, 1 Gal = 4407.3863 mL, and 1 pint = 389.6 g.
As noted in previous blog posts, testing was done on all of the rations (butter and cheese were not made in our experiment, so approximated using the USDA nutrition charts) which allowed us to find out the percentage of each macronutrient–protein, total carbohydrate, lipid, water/moisture, and fiber. Of these macronutrients, fiber and moisture do not provide calories, meaning fiber must be subtracted from the total carbohydrate value before a caloric count is accurate.
For example, biscuit consisted of about 16% protein, 4% lipid, 11% water, and therefore the remainder, ~69%, accounts for total carbohydrates (along with some micronutrients that make very minimal difference in weight so are omitted in the macronutrient equation). Then, carbohydrates were broken down even more into fiber vs. non-fiber using approximations from the NDF values mentioned in Alyssa’s post (these will be further adjusted after a caloric count is obtained for all items with carbs using an independent method, but these are approximations at the moment). The biscuit’s total carbs could be divided into 42% non-fiber carbs and 27% fiber. Once all of that was figured out for each ration (except for beer because we’re waiting on those results), the total weekly caloric intake was 23,066.114 cal, or approximately 3,300 calories a day in addition to energy from beer.
| Table 1: Weekly Ration Results from Croom | ||||||||
| Sample | Total Weekly Rations | Converted Total | Mean % Protein | Total Protein | Mean % Lipid | Total Lipid | Mean % Carb | Total Carb |
| Biscuit | 7 lbs | 3175.2 g | 16 | 508.032 g | 4 | 127.008 g | 69 | 2190.888 g |
| Beer | 7 Gal | 30851.7041 mL | ~0 | ~0 g | ~0 | ~0 g | * | * |
| Beef | 4 lbs | 1814.4 g | 34 | 616.896 g | 4 | 72.576 g | 1 | 18.144 g |
| Pork | 2 lbs | 907.2 g | 30 | 272.16 g | 20 | 181.44 g | 1 | 9.072 g |
| Peas | 2 pints | 779.2 g | 27 | 210.384 g | 3 | 23.376 g | 55 | 428.56 g |
| Oatmeal | 3 pints | 1168.8 g | 15 | 175.32 g | 6 | 70.128 g | 68 | 794.784 g |
| Butter* | 4 oz | 172.08 mL | 0.85 | 1.46 g | 81.11 | 139.57 g | 0.06 | 0.103 g |
| Cheese* | 12 oz | 340.2 g | 33.33 | 113.388 g | 26 | 88.452 g | 0 | 0 g |
| Total | 39208.7841 g | 1897.64 g | 702.55 g | 3441.551 g** | ||||
*Excluding beer
| Figure 2: Caloric Intake from Croom’s Rations | ||||||
| Sample | Calories of Protein | Calories of Lipid | % Non-fiber Carb | % Fiber | Calories of non-fiber Carb | Total Calories |
| Biscuit | 2032.128 | 1143.072 | 42 | 27 | 5334.336 | 8509.536 |
| Beer | ~0 | ~0 | * | * | * | * |
| Beef | 2467.584 | 653.184 | 1 | 0 | 72.576 | 3193.344 |
| Pork | 1088.64 | 1632.96 | 1 | 0 | 36.288 | 2757.888 |
| Peas | 841.536 | 210.384 | 32 | 23 | 997.376 | 2049.296 |
| Oatmeal | 701.28 | 631.152 | 58 | 10 | 2711.616 | 4044.048 |
| Butter | 5.84 | 1256.13 | 0.06 | 0 | 0.412 | 1262.382 |
| Cheese | 453.552 | 796.068 | 0 | 0 | 0 | 1249.62 |
| Total | 7590.56 | 6322.95 | 9152.604* | 23066.114* | ||
*Excluding beer
Working on the results for our paper had me doing a lot of conversions and math, but it was actually surprisingly therapeutic. There’s something about figuring how many grams are in 1 pint based on Elizabeth I’s tax laws that really makes it all worthwhile.
Stay tuned as our beer and wine assays have just come in and will be posted here just around the corner!