By Grace Tsai
We’ve been hard at work in the lab and are finally getting results thanks to the collaboration and help of several on- and off-campus professors, researchers, students, and labs.
The majority of the nutritional work is being done in Dr. Susanne and Dr. Steve Talcott’s food and nutritional lab by Grace, the PI, and a few interested Aggie Research Scholars students.
First, we ran an ascorbic acid assay just to confirm that the food did not magically spontaneously generate vitamin C. First the solid food items were ground up so that any vitamin C present could be extracted from it and stabilized using HPO3 and acetic acid. After this solution was made and added to the ground food items, we used the 2,6-dichlorophenol test which tests for L-ascorbic acid, but could also react to any reducing agent in the food with a redox potential such as polyphenols (that wine and beer may contain). The polyphenols in these items were filtered out using a carbon filter, and then titrated. Upon the first drop of the titration, every single food item reached its endpoint (changed color immediately). In short, no detectable amount of vitamin C is present. If sailors lived on this diet for a few months, it is likely they would develop scurvy. The onset of scurvy also depends on how much vitamin C the individual had prior to setting sail and being put on this diet with practically no ascorbic acid, which is the reason scurvy did not show up in all sailors at the same time. However, if kept on this diet for approximately 3 months or so, every person would almost be guaranteed to have scurvy. TL;DR: SAILORS MOST LIKELY HAD SCURVY. 8-O No surprise here.

Erika Davila carefully weighing the ground food items into crucibles for the moisture test.
A moisture test was run on the dried food items. This involves careful weighing of each food item in ceramic crucibles and drying them in an oven at about 90C which would allow the moisture to dissipate without burning off the other nutritional components of the foods. After the food is fully dried (normally 24 to 36 hours) the food is weighed again and the difference divided by the original weight. For some reason, the oven in the laboratory was unable to reach the 90C, so we compensated by keeping the food items in the oven at between 70 to 85C for a few extra hours to ensure that the foods were fully dried. Our results are as follow:
| Sample | Pre-Drying | Post-Drying | Weight of H2O (g) | % Moisture | |
| Peas | Crucible (g) | Crucible+Sample (g) | Crucible+Sample (g) | ||
| #22 (Before) | 18.2049 | 25.9719 | 25.1345 | 0.8374 | 10.78054 |
| #184 (After) | 17.5271 | 22.6825 | 22.1305 | 0.552 | 10.70722 |
| Cooked Beef | |||||
| #44 (Before) | 10.3173 | 15.7726 | 12.2130 | 3.5596 | 65.25031 |
| #209 (After) | 10.5031 | 15.5306 | 12.6685 | 2.8621 | 56.92889 |
| #234 (Control) | 11.1040 | 16.3375 | 13.8277 | 2.5098 | 47.95643 |
| Cooked Pork | |||||
| #43 (Before) | 11.5729 | 13.0607 | 12.2126 | 0.8481 | 57.00363 |
| #173 (After) | 11.0698 | 16.0944 | 13.5720 | 2.5224 | 50.20101 |
| #236 (Control) | 12.9467 | 17.5484 | 15.8968 | 1.6516 | 35.89108 |
| Cooked Cod | |||||
| #78 (Before) | 12.7453 | 18.0127 | 14.1707 | 3.842 | 72.93921 |
| #226 (After) | 10.5134 | 15.6007 | 12.1337 | 3.467 | 68.1501 |
| Biscuit | |||||
| #23 (Before) | 12.6365 | 17.7018 | 17.2291 | 0.4727 | 9.332122 |
| #186 (After) | 12.4064 | 17.5783 | 17.0435 | 0.5348 | 10.34049 |
| Rice | |||||
| #21 (Before) | 10.7454 | 15.7649 | 15.1914 | 0.5735 | 11.42544 |
| #187 (After) | 11.8778 | 16.4105 | 15.8886 | 0.5219 | 11.51411 |
| Flour | |||||
| #20 (Before) | 10.8795 | 12.9816 | 12.7585 | 0.2231 | 10.6132 |
| #183 (After) | 10.2123 | 15.1097 | 14.5811 | 0.5286 | 10.79348 |
| Oatmeal | |||||
| #24 (Before) | 10.8149 | 15.4789 | 15.1450 | 0.3339 | 7.159091 |
| #185 (After) | 10.9823 | 16.0236 | 15.5950 | 0.4286 | 8.501775 |
Notice that the wet goods (primarily meats) all decreased in water content, whereas the dried goods mostly remained the same. The decrease in moisture content is most likely due to osmosis between the meat and the highly salty brine, which helped the preservation of the meat.
Read more here to find out more about moisture tests and the reason they are important:
http://nfscfaculty.tamu.edu/talcott/courses/FSTC605/Food%20Product%20Design/Managing%20Moisture.pdf
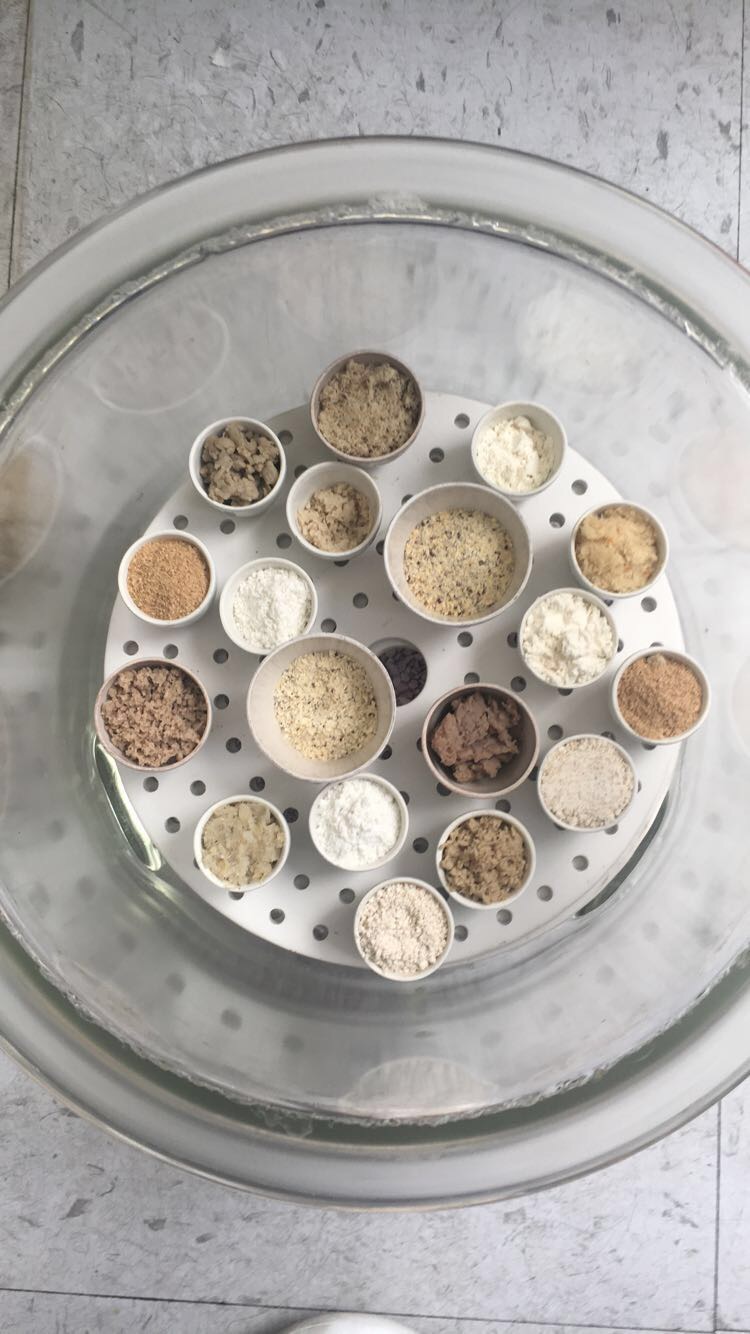
All the ground up food items in the dessicator ready for drying! It looks like we are making food for a tiny village.
In addition to vitamin C and moisture, we also tested for lipid oxidation. There are a few different ways we are quantifying the oxidation of the lipids from the meat, which is one of the causes of rancidity. GCMS is being run in the Meat Science Lab under Dr. Christopher Kerth and Kayley Wall, and we also ran TBARS , or the thiobarbituric acid reactive substances assay. In this test, meat is weighed out into test tubes, and TBA reagent and ethanol (or butanol) is added to create a reaction with the lipid peroxides, specifically malonaldehyde, in the meat. This is then heated in a water bath at 95C for 1 hour for the reaction to occur. The more oxidation there is, the darker the liquid turns, which is measured in a spectrophotometer at 532 nm. A standard curve made with the same reagents, but with controlled amounts of malonaldehyde added is then used to create a linear equation in which we can plug in the reading from the samples to know the true value of oxidation.

The meat samples after TBARS. Note their deep color that indicates heavy oxidation.
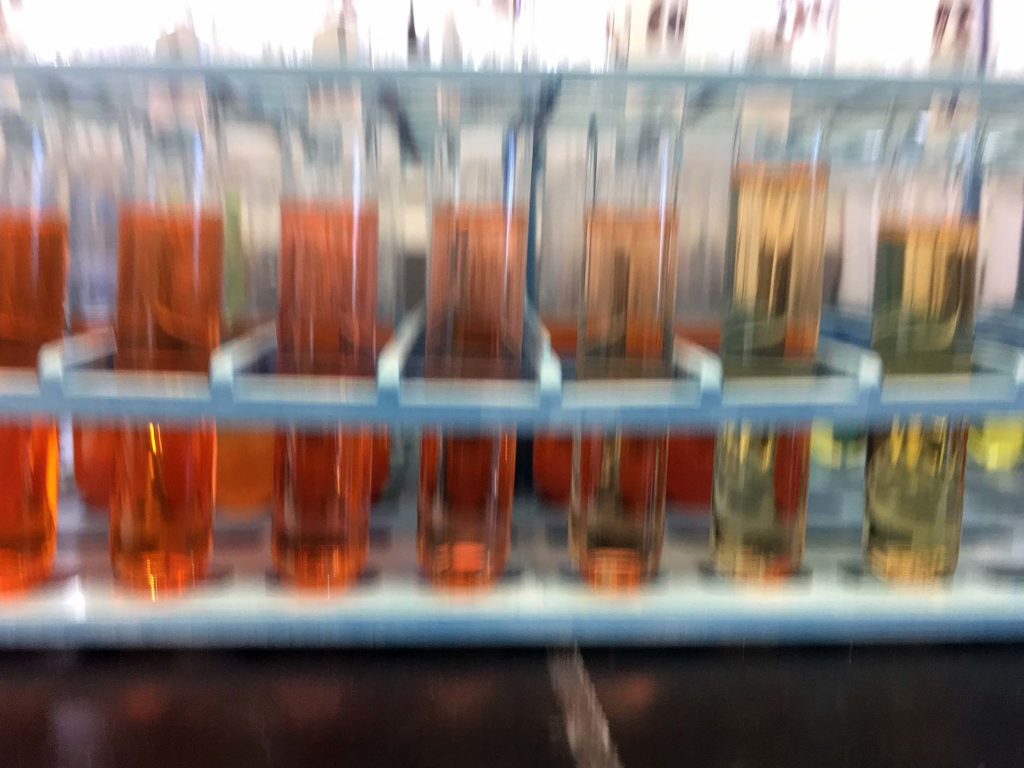
The standard solution. Note the gradual color gradient from dark on the left, to light on the right, that can be used to create a standard curve to measure true values in the meat samples in the image above.
We’ll share the results of this test in the post! So stay tuned.
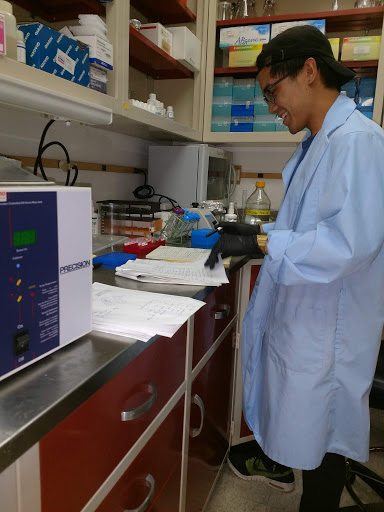
Christian Encarnacion hard at work in the lab.
At the USDA-ARS laboratory, we are continuing our work with Dr. Robin Anderson in his lab to culture, isolate, and sequence the pure cultures from the different plates. Christian Encarnacion, one of our undergraduate Aggie Research Scholars, has been learning how to run PCR and wrote a short blurb about his experiences:
“In the lab, I’ve been learning the process of how we can identify what specific types of bacteria are growing in our beef and French bay salt samples. I’ve learned how to amplify DNA segments via polymerase chain reaction (PCR) through a neat device called the thermocycler. This machine helps us generate thousands and thousands of DNA copies of the unknown bacteria. After this, we run these samples through gel electrophoresis in order to get a visualization of the DNA fragments. If the DNA fragments of our samples match up with a known Ladder sample, specifically at 1500 base pairs, then that means we are confident that there is bacterial DNA. We then send the DNA samples off to a separate lab where they run the DNA through a database that will identify the specific taxa of the bacteria. We have plenty of samples left to go through, so I am excited with this new work and the interesting results we’ll be getting over the coming weeks!”
Meanwhile, we sent off several samples for 16s metagenomic testing to Dr. Andrew Hillhouse who is a professor at Texas A&M University’s vet school and the Associate Director of the Texas A&M Institute for Genome Sciences and Society (TIGSS) Molecular Genomics Workspace (you can check out their services and some of the other projects they have going on here). Although we are already sequencing as many of the live bacteria as we are able to culture at the USDA, we are also interested in the big picture of the microbes that may have played a role in food preservation or spoilage, even if they are not culturable due to exhausting their food source during the experiment, or because they did not like the media we were growing them in. This will allow us to have a near complete profile of the full diversity within each of the samples. So far, several of the samples have had their DNA extracted in preparation for sequencing. The results can be seen below:
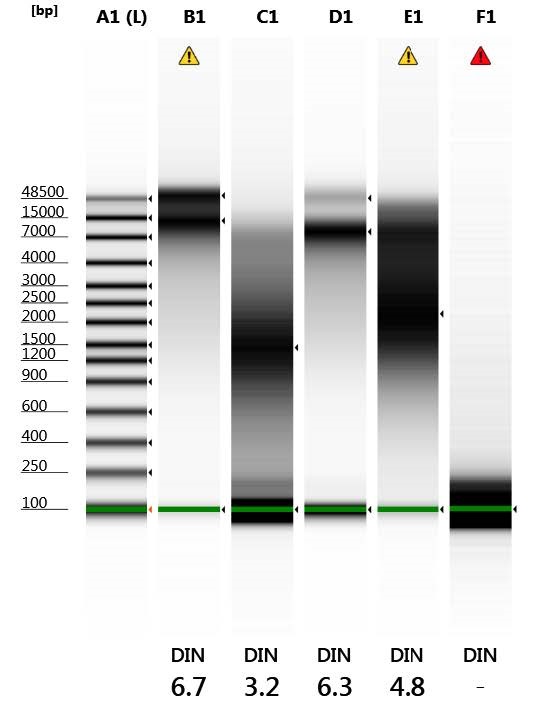
Molecular weight of the extracted DNA (See key below). Image courtesy of Dr. Andrew Hillhouse.
| Well | DIN | Sample Description |
| A1 | – | Ladder |
| B1 | 6.7 | Beef Before |
| C1 | 3.2 | Beef After |
| D1 | 6.3 | Pork Before |
| E1 | 4.8 | Pork After |
| F1 | – | Blank |
Overall, the “before” samples (B1 and D1) show more intact DNA whereas the “after” samples (C1 and E1) show DNA degradation.
We’ll report more results as they come in!